Social Media Marketing
Social Media Metrics Businesses Should Track
A practical guide to reach, impressions, engagement, watch time, clicks, leads, conversions, and next actions.
By Tayyiba Suleman - Published July 16, 2026 - Updated July 17, 2026 - 6 min read

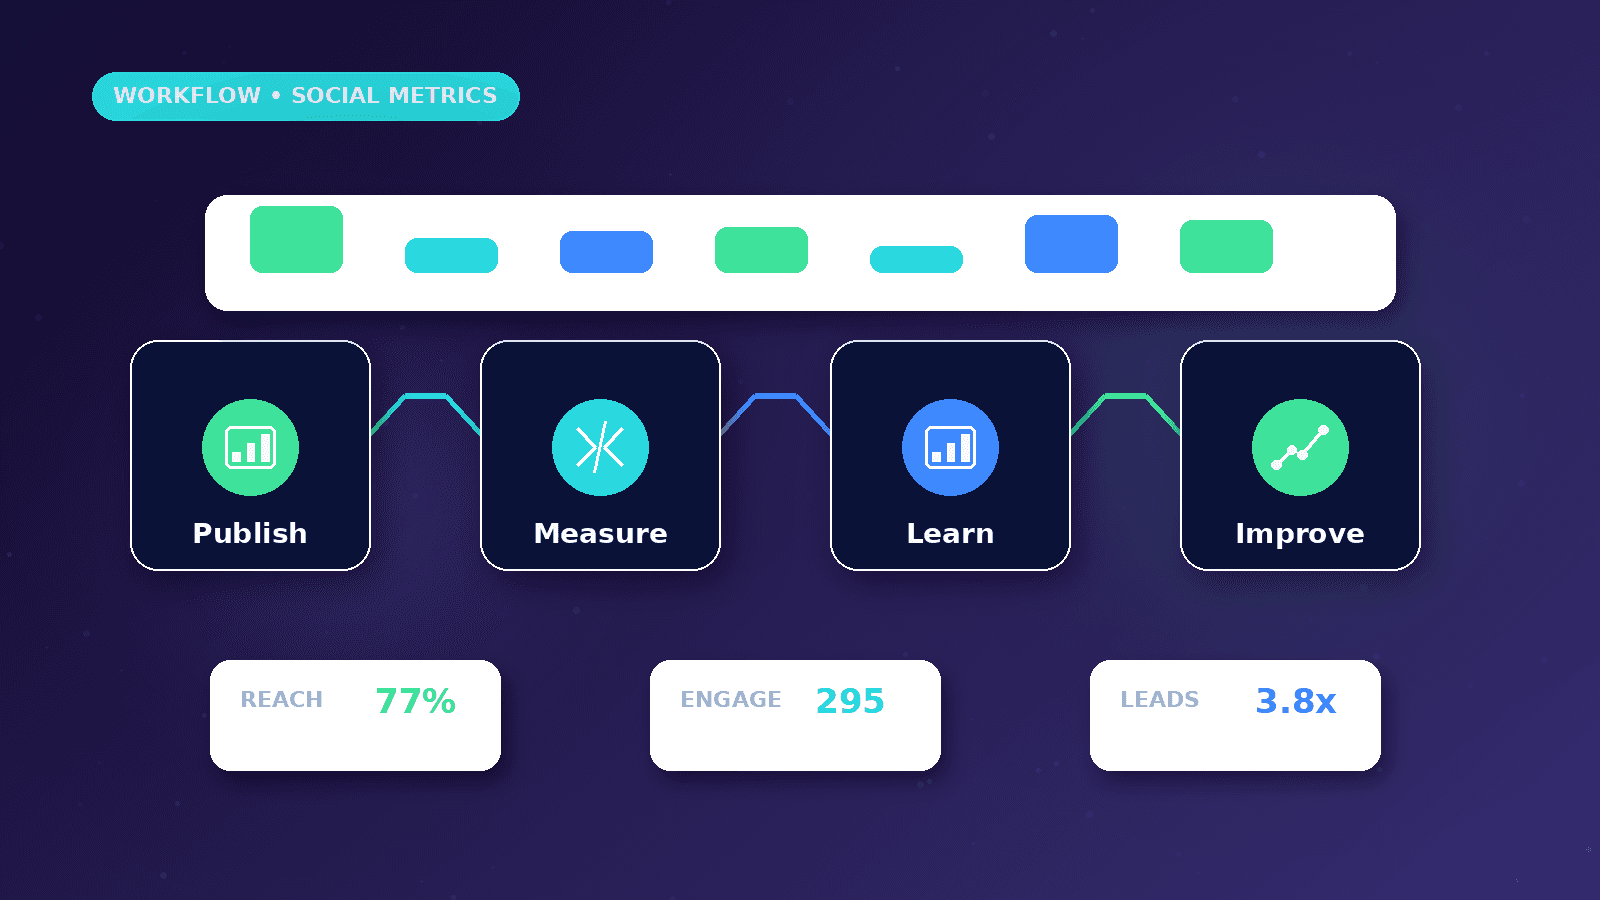
Social media reporting should separate visibility, engagement, traffic, leads, and revenue-related outcomes. Vanity metrics can be useful signals, but they should not replace qualified inquiries, conversion tracking, and business context. Use this article when a business needs a reporting framework that separates awareness, engagement, traffic, leads, conversion quality and revenue-related outcomes.
Reader outcome: Track useful social metrics. This article is educational, uses safe CurrentReach AI-owned visuals, and labels illustrative examples where they appear.
How this guide was prepared
This article is written for CurrentReach AI readers using service-planning experience, website implementation patterns, SEO checks, automation workflow review, and practical measurement considerations. It is not copied from a third-party report or generated from private account data.
Connects content planning with audience, campaigns, CTAs and CRM follow-up.
Separates engagement metrics from real business outcomes.
Avoids viral-growth promises and unsupported performance claims.
Awareness metrics
Reach estimates how many people saw content. Impressions count how many times content was displayed. One person can create multiple impressions.
Awareness metrics help show distribution, but they do not prove business value alone.
Review reach and impressions by platform, content pillar, and format.
Engagement metrics
Engagement includes actions such as likes, comments, shares, saves, profile visits, replies, and link clicks depending on platform reporting.
Engagement rate helps compare posts of different sizes, but calculation methods vary. Be consistent in your own reporting.
Saves, shares, meaningful comments, and direct messages can be more useful than passive likes for many service businesses.
Video metrics
Watch time, average view duration, retention, completion rate, and replay behavior help evaluate short-form and long-form videos.
A video with fewer views but better retention from the right audience may be more useful than a viral clip that attracts the wrong people.
Hooks, pacing, captions, framing, and topic selection all affect retention.
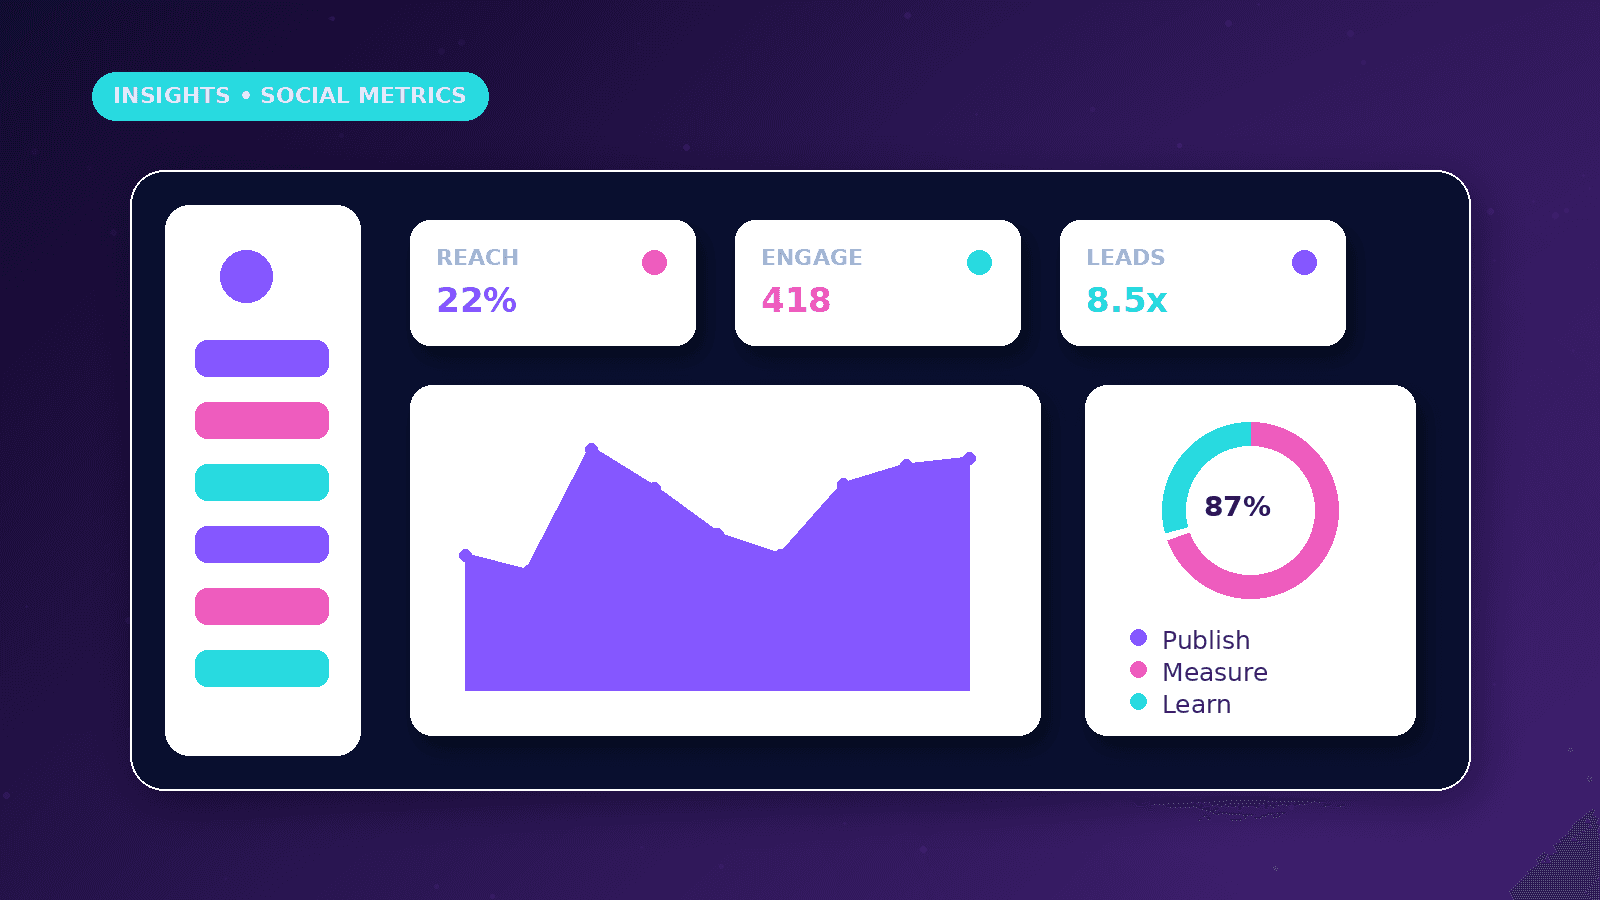
Traffic and lead metrics
Click-through rate shows how often viewers move from content to the next step. Track website clicks, WhatsApp clicks, booking clicks, and form submissions where configured.
Leads should be reviewed for quality: service fit, budget fit, geography, urgency, and response quality.
Cost per lead and conversion rate matter only when tracking is set up correctly and the lead definition is clear.
ROAS and revenue metrics
Return on ad spend should only be reported when revenue attribution is reliable. For many service businesses, sales cycles and offline conversations make simple ROAS reporting incomplete.
Use pipeline stages when immediate revenue attribution is not possible: inquiry, qualified lead, booked call, proposal sent, won, lost.
Avoid presenting estimated revenue as verified revenue unless the source is clear.
Example dashboard table
Awareness: reach, impressions, follower growth.
Engagement: engagement rate, saves, shares, comments.
Video: watch time, retention, completion rate.
Traffic: clicks, CTR, landing-page visits.
Business: leads, qualified leads, bookings, cost per qualified lead where available.
Formulas and definitions
Engagement rate can be calculated as total engagements divided by reach multiplied by 100. Click-through rate can be calculated as clicks divided by impressions multiplied by 100.
Conversion rate should use a relevant denominator, such as conversions divided by landing-page visits or qualified clicks multiplied by 100. Cost per lead is advertising spend divided by qualified leads.
ROAS is attributed revenue divided by advertising spend, but it should only be used when revenue attribution is reliable. Service businesses with offline sales conversations often need pipeline reporting instead of simple ROAS claims.
Organic versus paid reporting
Organic reporting should focus on audience fit, content relevance, saves, shares, comments, profile actions, clicks and whether content supports trust over time.
Paid reporting needs cost, targeting, creative, placement, landing-page and conversion context. A paid campaign can create reach quickly, but the business still needs to judge lead quality.
Attribution has limits. A person may see a reel, search the brand later, read a service page and then send a WhatsApp message. Reports should acknowledge that path instead of pretending every conversion has one simple source.
Worked business example
Illustrative example: a monthly report shows reach increased, engagement rate fell, CTR improved and qualified leads stayed flat. The correct response is not simply to post more; it is to inspect distribution, hook quality, CTA clarity and landing-page fit.
A reel with strong watch time but no clicks may be good for awareness. A carousel with fewer views but more saves and qualified inquiries may be more valuable for a service business.
The report should label sample values clearly and separate organic performance from paid campaigns so the team does not mistake boosted reach for organic traction.
Common mistakes to avoid
Reporting only follower count and likes makes social activity look simple but does not explain whether the right people are moving toward the business.
Mixing organic and paid metrics without labels can confuse decisions because reach, cost and intent are different.
Claiming ROAS without reliable revenue attribution can mislead stakeholders, especially for service businesses with offline sales conversations.
Decision framework
Track awareness metrics when the goal is distribution, and track lead or conversion metrics when the goal is business inquiry.
Choose a consistent engagement-rate formula so month-to-month comparisons are meaningful.
Separate vanity signals from decision metrics. Saves, shares, clicks, qualified leads and booked conversations may matter more than raw likes.
Measurement plan
Use consistent formulas: engagement rate equals total engagements divided by reach times 100; CTR equals clicks divided by impressions times 100; conversion rate equals conversions divided by relevant visits or clicks times 100.
Paid metrics need cost context: cost per lead equals advertising spend divided by qualified leads, and ROAS equals attributed revenue divided by advertising spend when attribution is reliable.
Report weekly during active campaigns and monthly for evergreen organic content. Tie each review to a decision: repeat, improve, pause or test.
Risks and limitations
Platform definitions change, so reports should describe what each metric means in the current account context.
Attribution gaps can hide the role of social content in longer buying journeys.
Sample dashboards should be labelled as illustrative when they are not pulled from a verified live account.
Practical next steps
Build a monthly dashboard with reach, impressions, engagement, watch time, CTR, leads and qualified lead notes.
Review metrics by platform, pillar, format and campaign instead of only by total account activity.
Use the report to decide what to repeat, improve, pause or test next.
Conclusion
Social media metrics are useful only when they help the business make better decisions.
Separate visibility from engagement, engagement from traffic, and traffic from qualified leads so the report shows what to improve next instead of celebrating vanity numbers.
Illustrative example: social media dashboard review
All values are sample values for reporting structure only.
| Metric | Current period | Previous period | Change | Recommended action |
|---|---|---|---|---|
| Reach | 24,000 | 20,000 | +20% | Review distribution |
| Engagement rate | 4.1% | 4.8% | -0.7 pts | Review content relevance |
| CTR | 1.6% | 1.1% | +0.5 pts | Test hook and CTA |
| Leads | 18 | 15 | +3 | Review funnel |
| CPL | $22 | $26 | -$4 | Review targeting |
Practical checklist
- Reach
- Impressions
- Engagement
- Engagement rate
- Watch time
- Retention
- CTR
- Leads
- Conversion rate
- Cost per lead
- Qualified lead quality
References and further reading
Image sources
- social-media-metrics-businesses-should-track/featured-image.png: Original CurrentReach AI blog image pack. License: Owned generated visual. No private data present.
FAQs
Which social media metric matters most?
The most important metric depends on the goal. Awareness needs reach; lead generation needs qualified inquiries and conversion quality.
Why are reach and impressions different?
Reach estimates people exposed to content, while impressions count total displays. One person can create multiple impressions.
What is a good engagement rate?
A good rate varies by platform, audience and format. Use a consistent formula and compare against your own history.
When is ROAS reliable?
ROAS is reliable only when revenue attribution and ad spend are measured consistently for the same campaign period.
How often should social media performance be reported?
Weekly reporting fits active campaigns; monthly reporting is usually enough for ongoing organic planning.
Need help applying this?
Need a practical content calendar, campaign structure and reporting system? Explore CurrentReach AI’s Social Media Marketing Services.
Related guides
About the author
Tayyiba Suleman is Web Developer and Automation Developer. Articles are reviewed against the Editorial Policy and should be read with the Content Disclaimer.